Treating summary metrics as comprehensive indicators of data health represents a common operational vulnerability in automated business intelligence. The classic demonstration of this blind spot dates back to 1973, when British statistician Francis Anscombe assembled four distinct synthetic datasets now known as Anscombe’s Quartet.
Every dataset in the quartet contains eleven points with near-identical aggregate properties: an identical mean for the independent variable (9.0), an identical mean for the outcome variable (7.5), a matching trendline equation ($\hat{y} = 3.00 + 0.500x$), and an identical r-squared value of 0.67.
Dataset I: Clean linear distribution with typical scatter
Dataset II: Smooth, unbroken quadratic curve (non-linear)
Dataset III: Perfect linear alignment broken by a single vertical outlier
Dataset IV: Vertical cluster of identical X values plus one distant high-leverage point
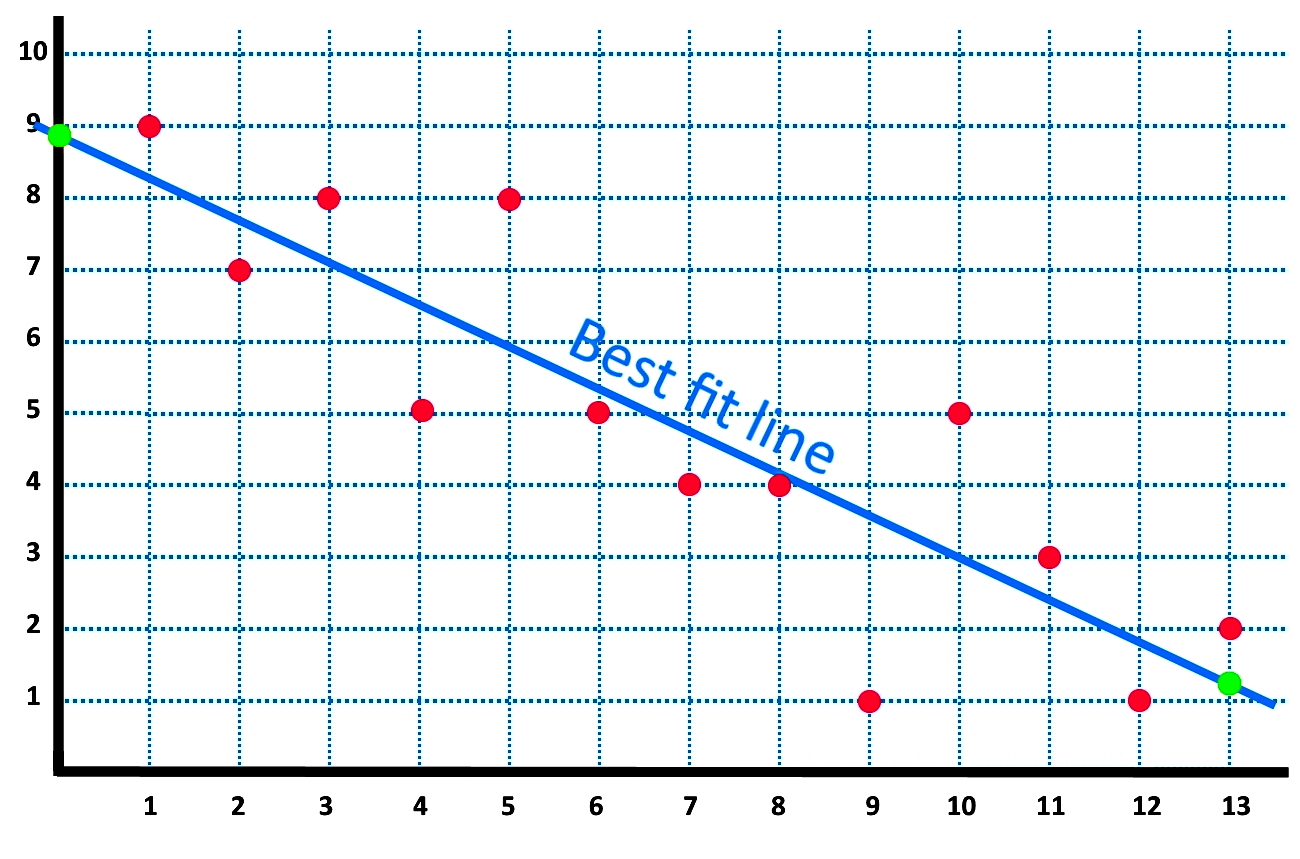
If an analyst looked purely at the regression output without rendering the underlying scatter plot, all four distributions would appear interchangeable. Plotting the data visually reveals that the linear fit is only statistically defensible for the first dataset. The second displays a curved parabolic arc where a straight line systematically miscalculates values at the extremes. The third contains a single rogue point pulling the slope away from an otherwise perfect line. The fourth exhibits extreme leverage, where ten identical $X$ values tell us nothing about slope, and an isolated outlier far to the right dictates the trendline angle single-handedly.
Modern data visualization must extend beyond basic scatter plots to incorporate rigorous residual plots. A residual plot maps the calculated errors along a neutral horizontal axis. If a linear regression model fits cleanly, the residuals scatter randomly around zero like white noise. If the residuals trace a distinct curve, a funnel shape, or an organized wave, the linear assumption is violated. In those situations, standard slope calculations produce misleading conclusions.

